BIOController
Tosoh’s BIOController™ software is a Windows application used to control the Octave® BIO.
BIOController features an intuitive, user-friendly interface that allows rapid mastery of its powerful functionality.
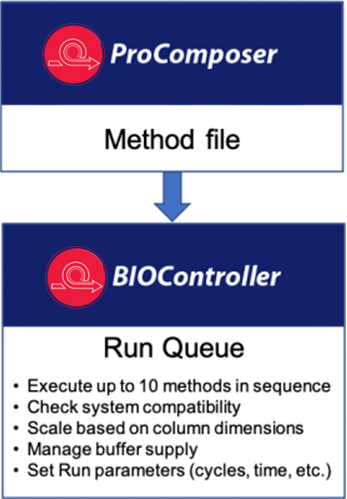
Methods are written with the ProComposer™
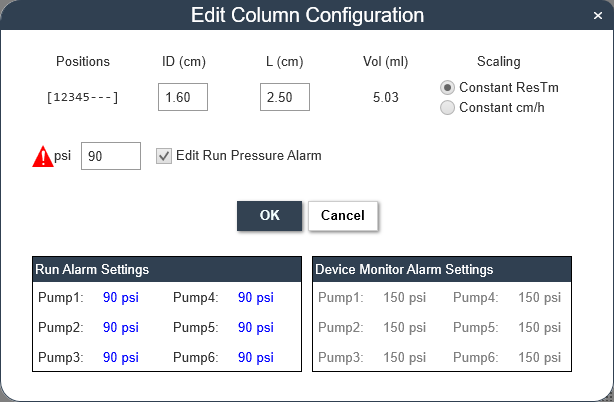
application and transferred into BIOController’s Run Queue. The methods can be used with any size columns that match the capabilities of the Octave BIO because BIOController adjusts the time, volume and flow rate parameters based on the column dimensions and scaling selection entered in the Run Queue Manager. Each method is repeated within the sequence for a defined number of cycles, indefinitely, or for a set time.
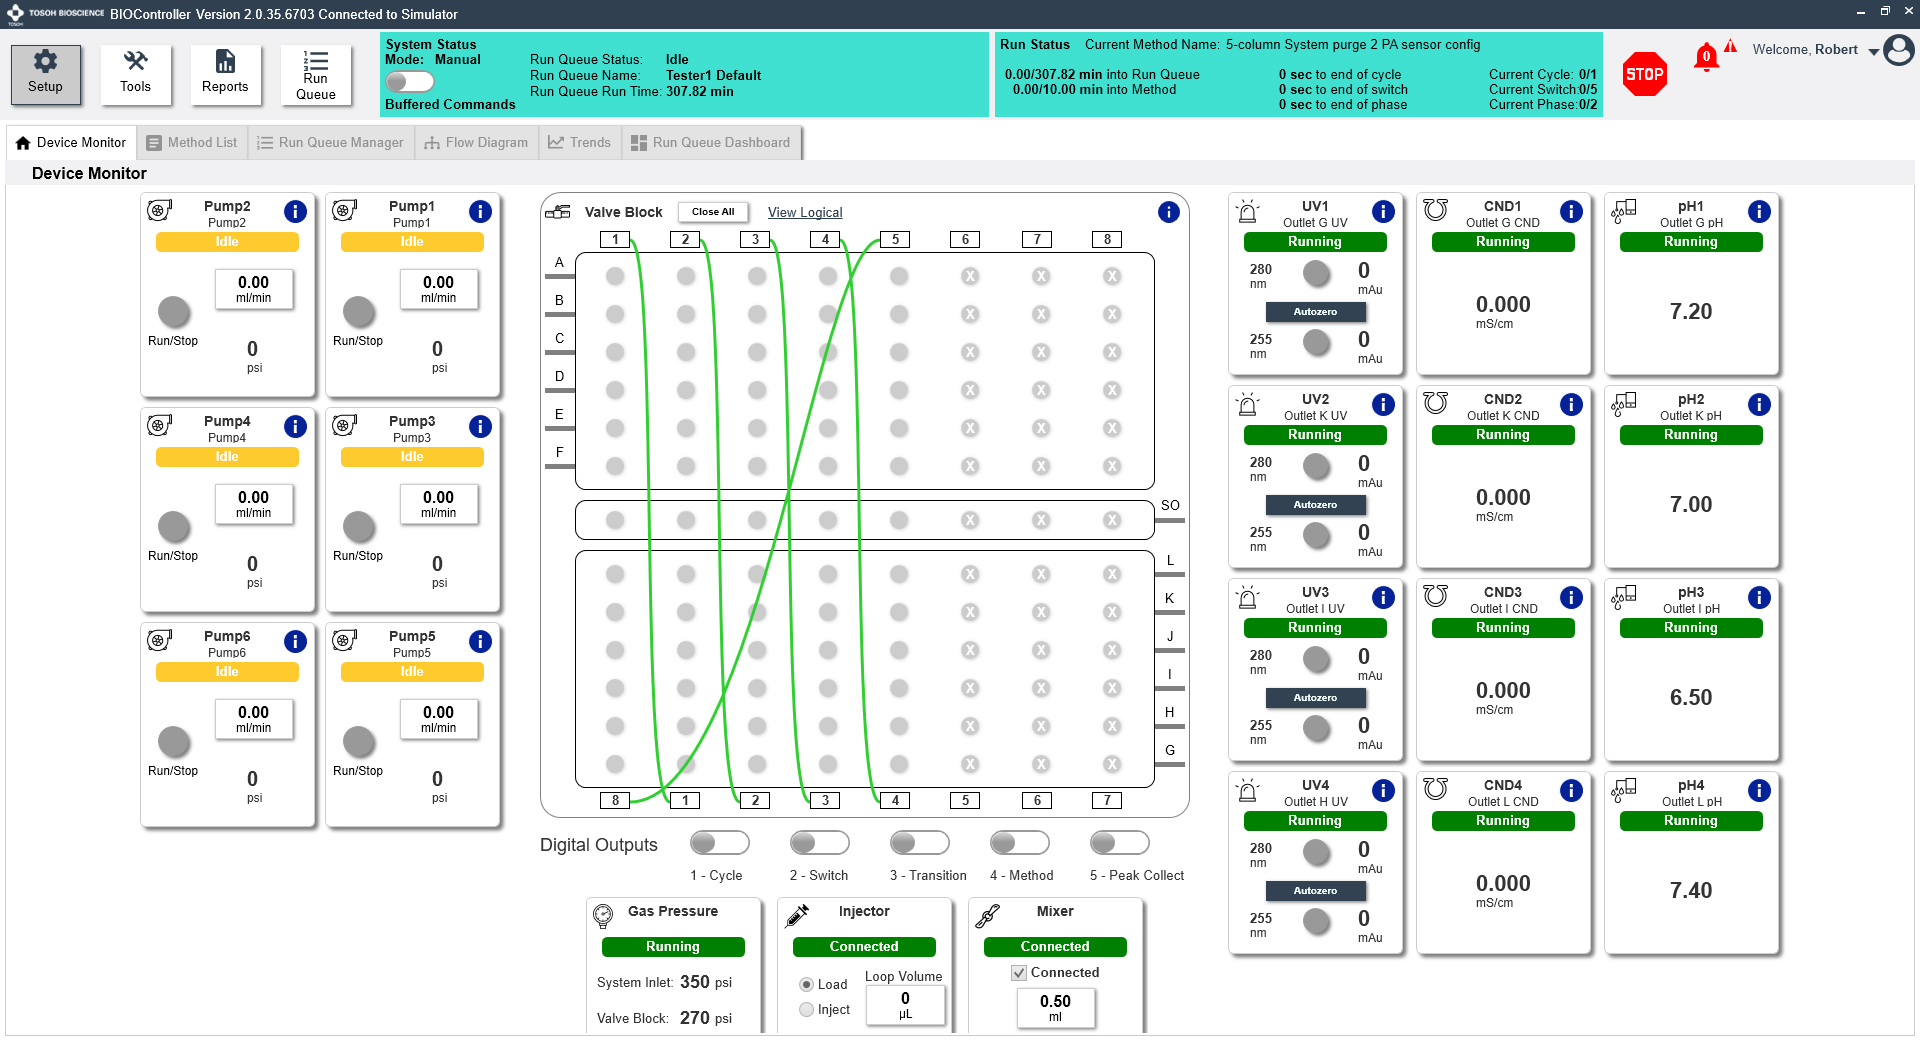
The graphical user interface provides straightforward controls for devices, method files, and run parameters.
Edit methods quickly and easily in the linked ProComposer application.
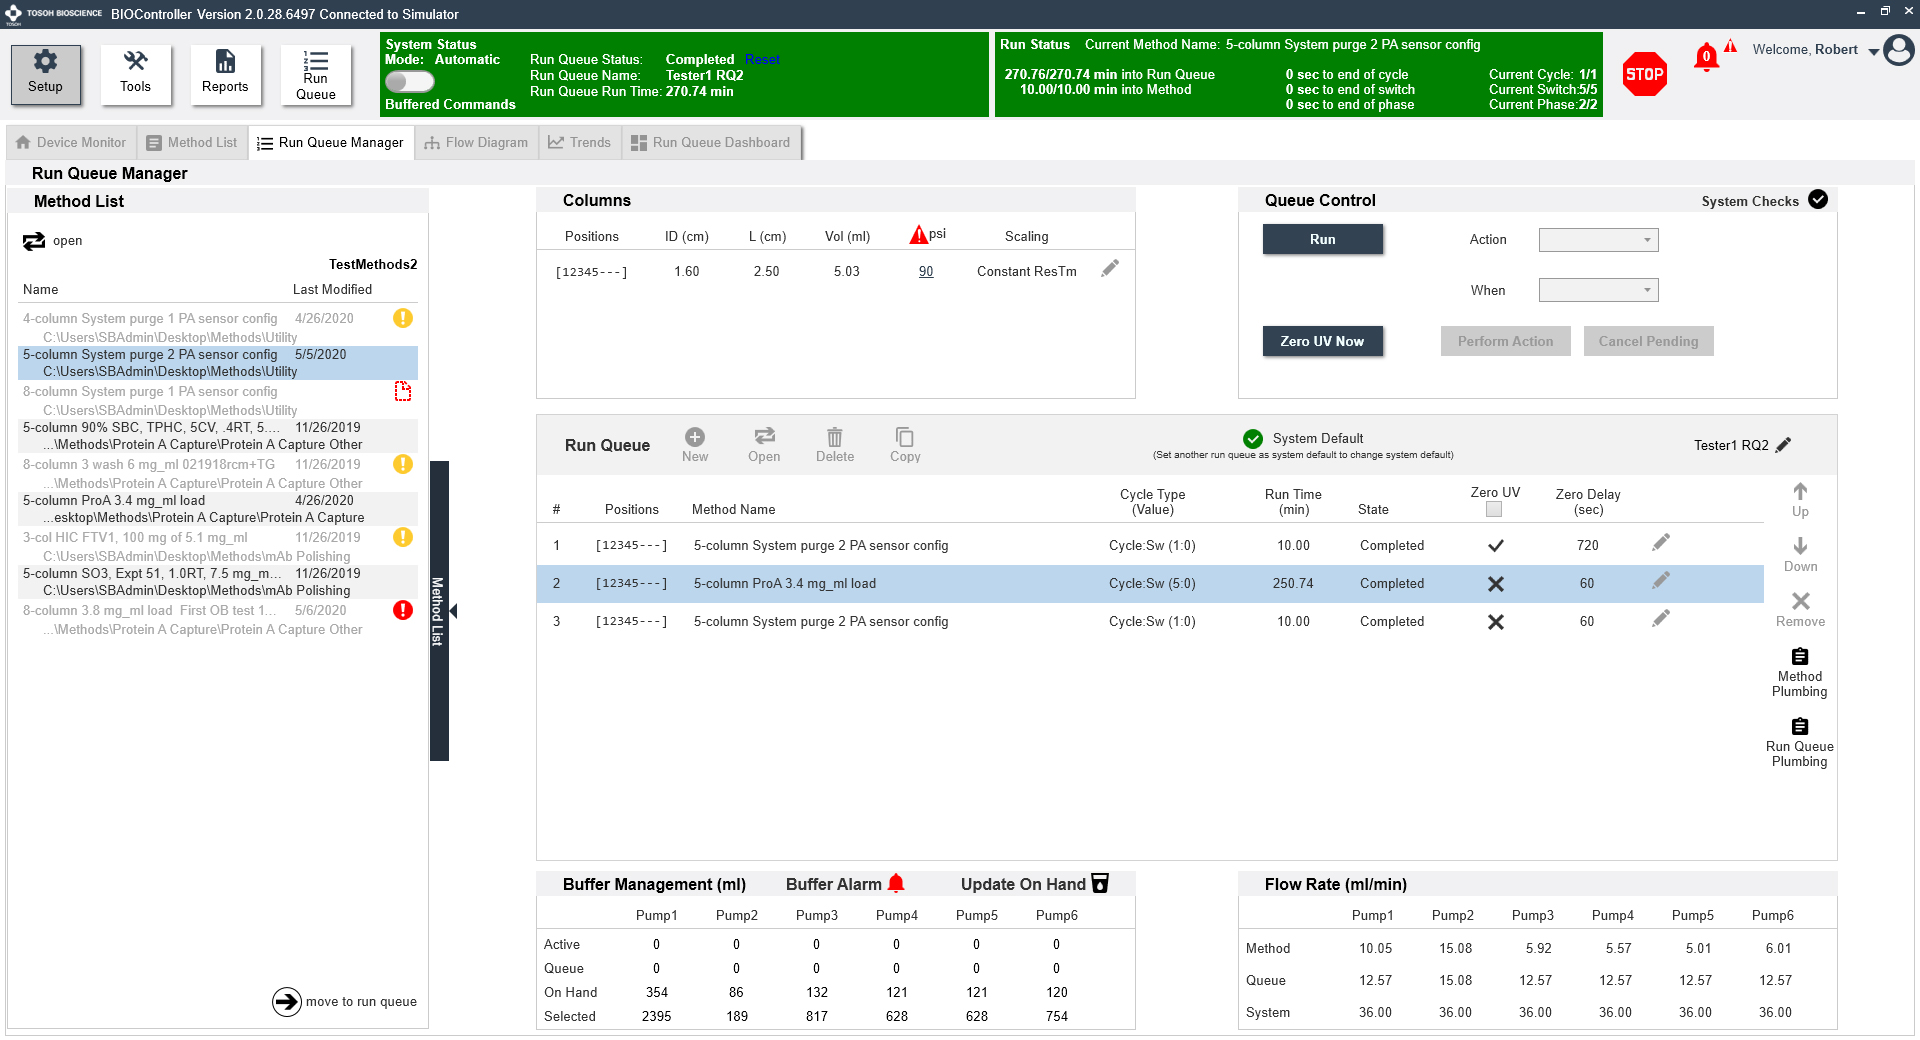
Different column dimensions connected to different positions on the valve block during the same method queue.
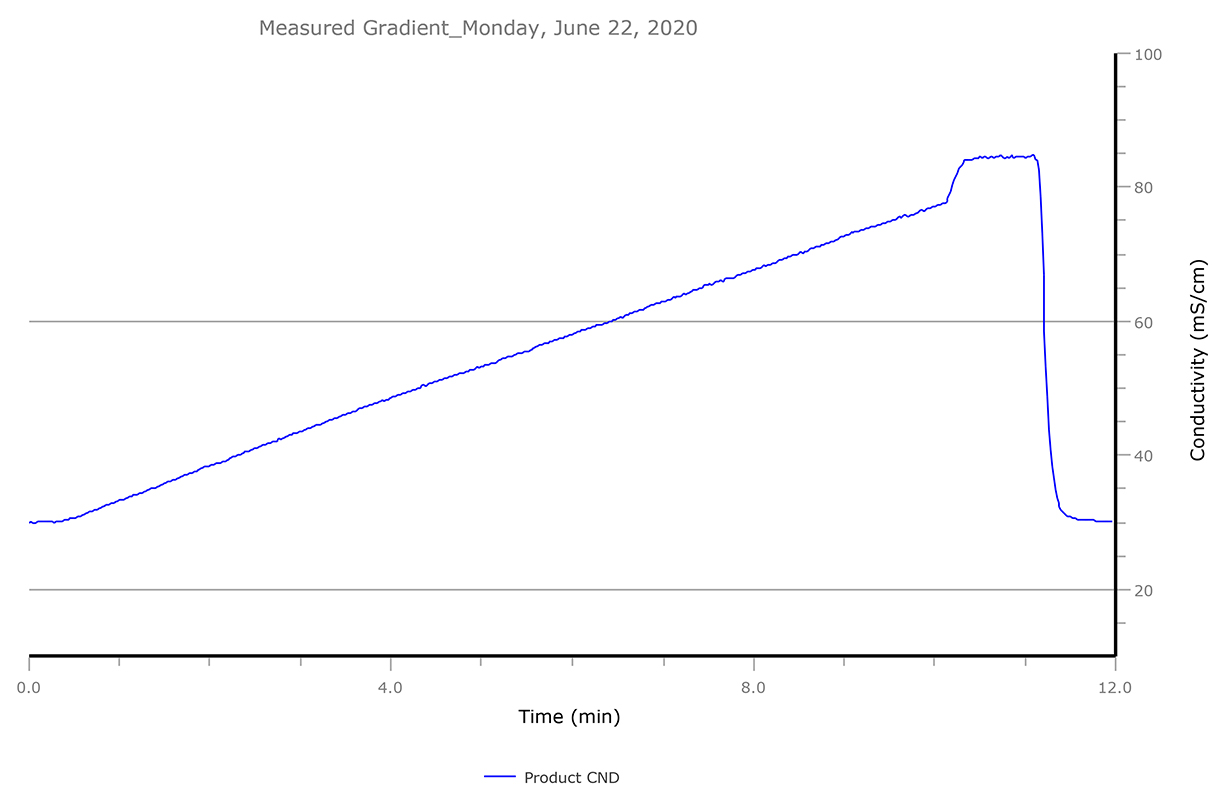
BIOController supports gradients and the injection valve in single or multicolumn mode.
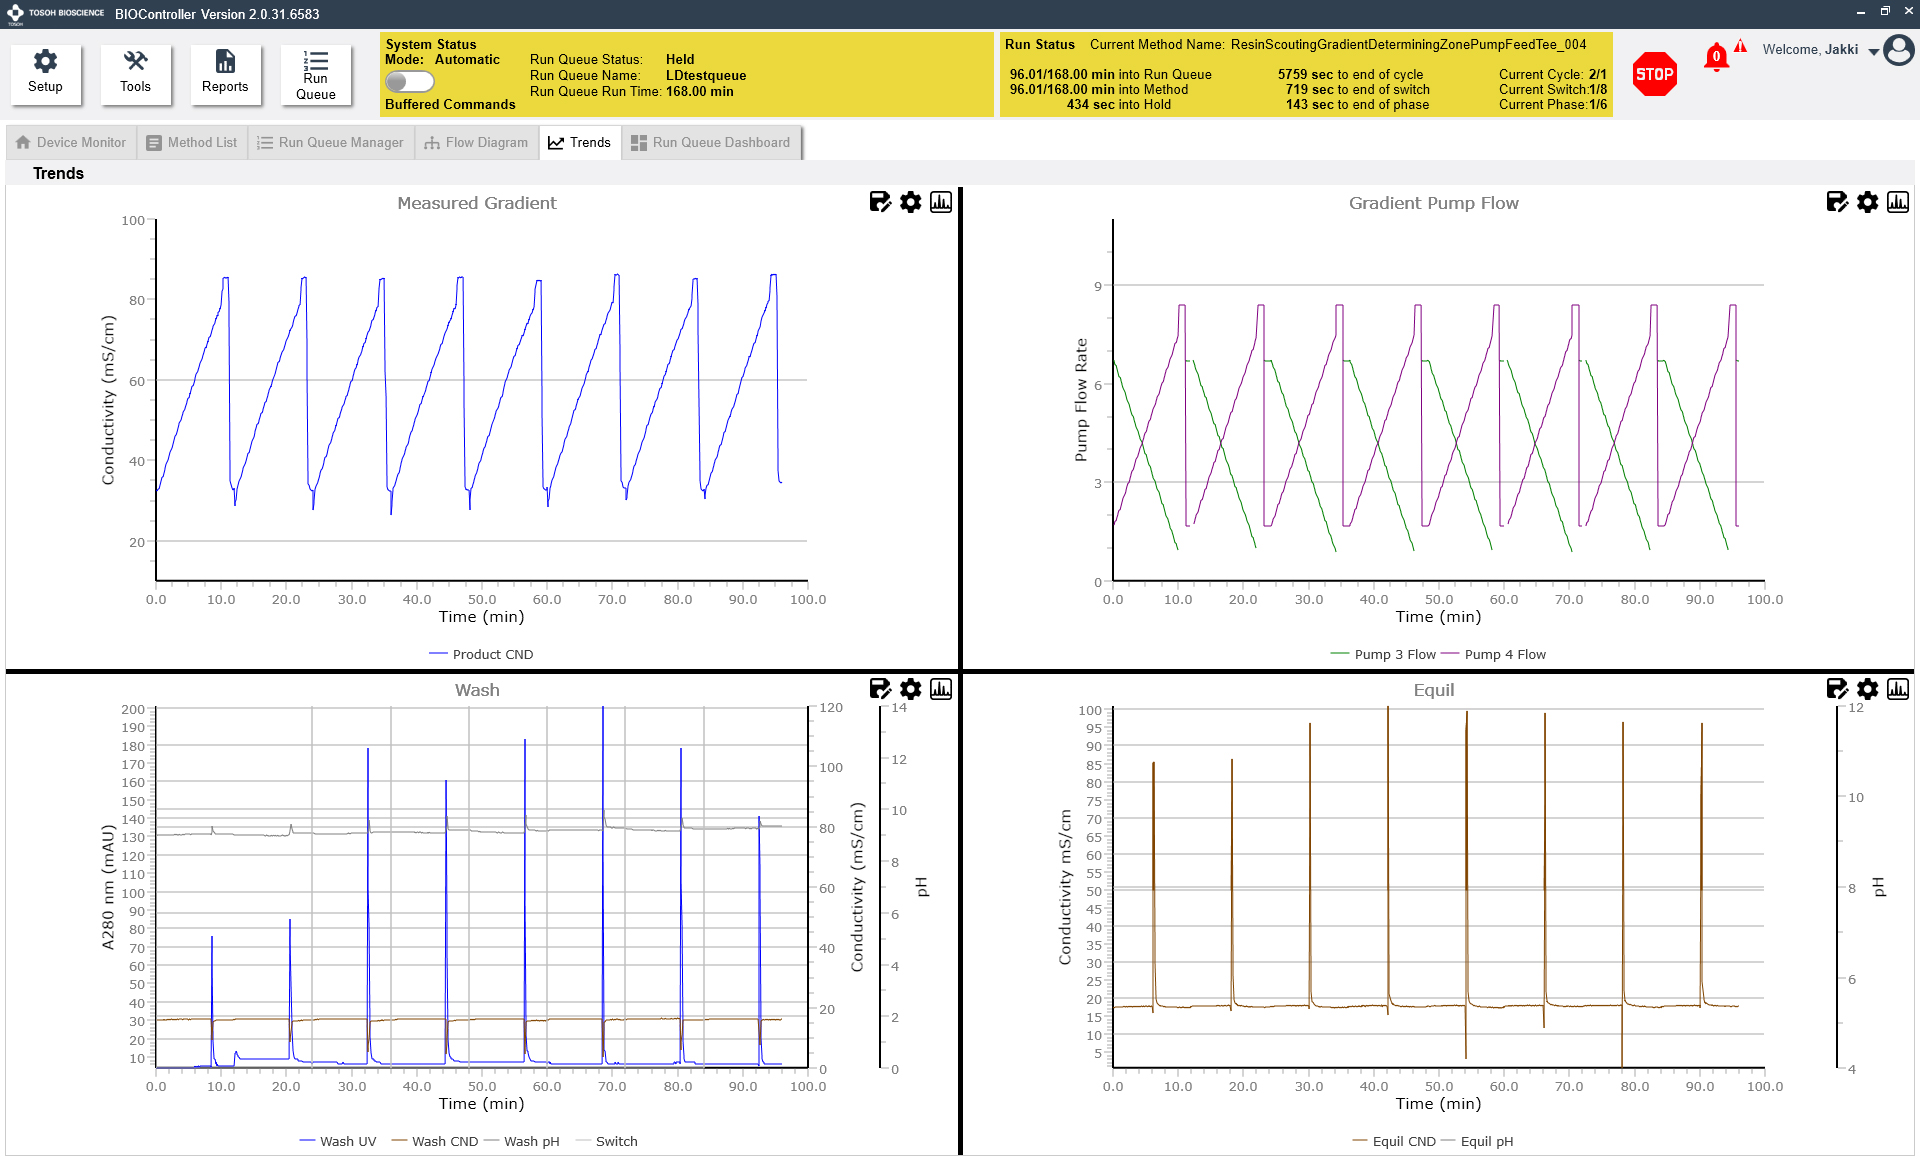
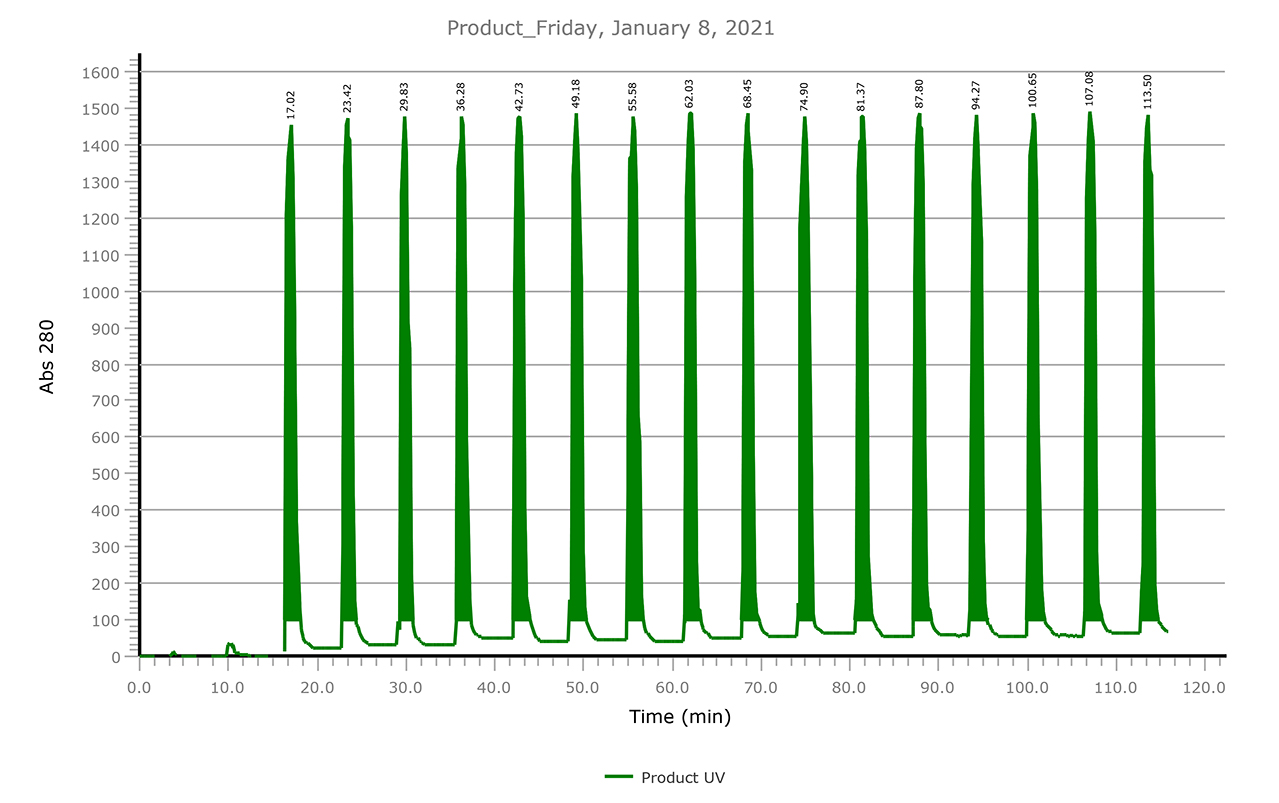
Four separate charts display output from the various sensors.
Plumbing connections for pumps, columns, valve block, and sensors are clearly shown.
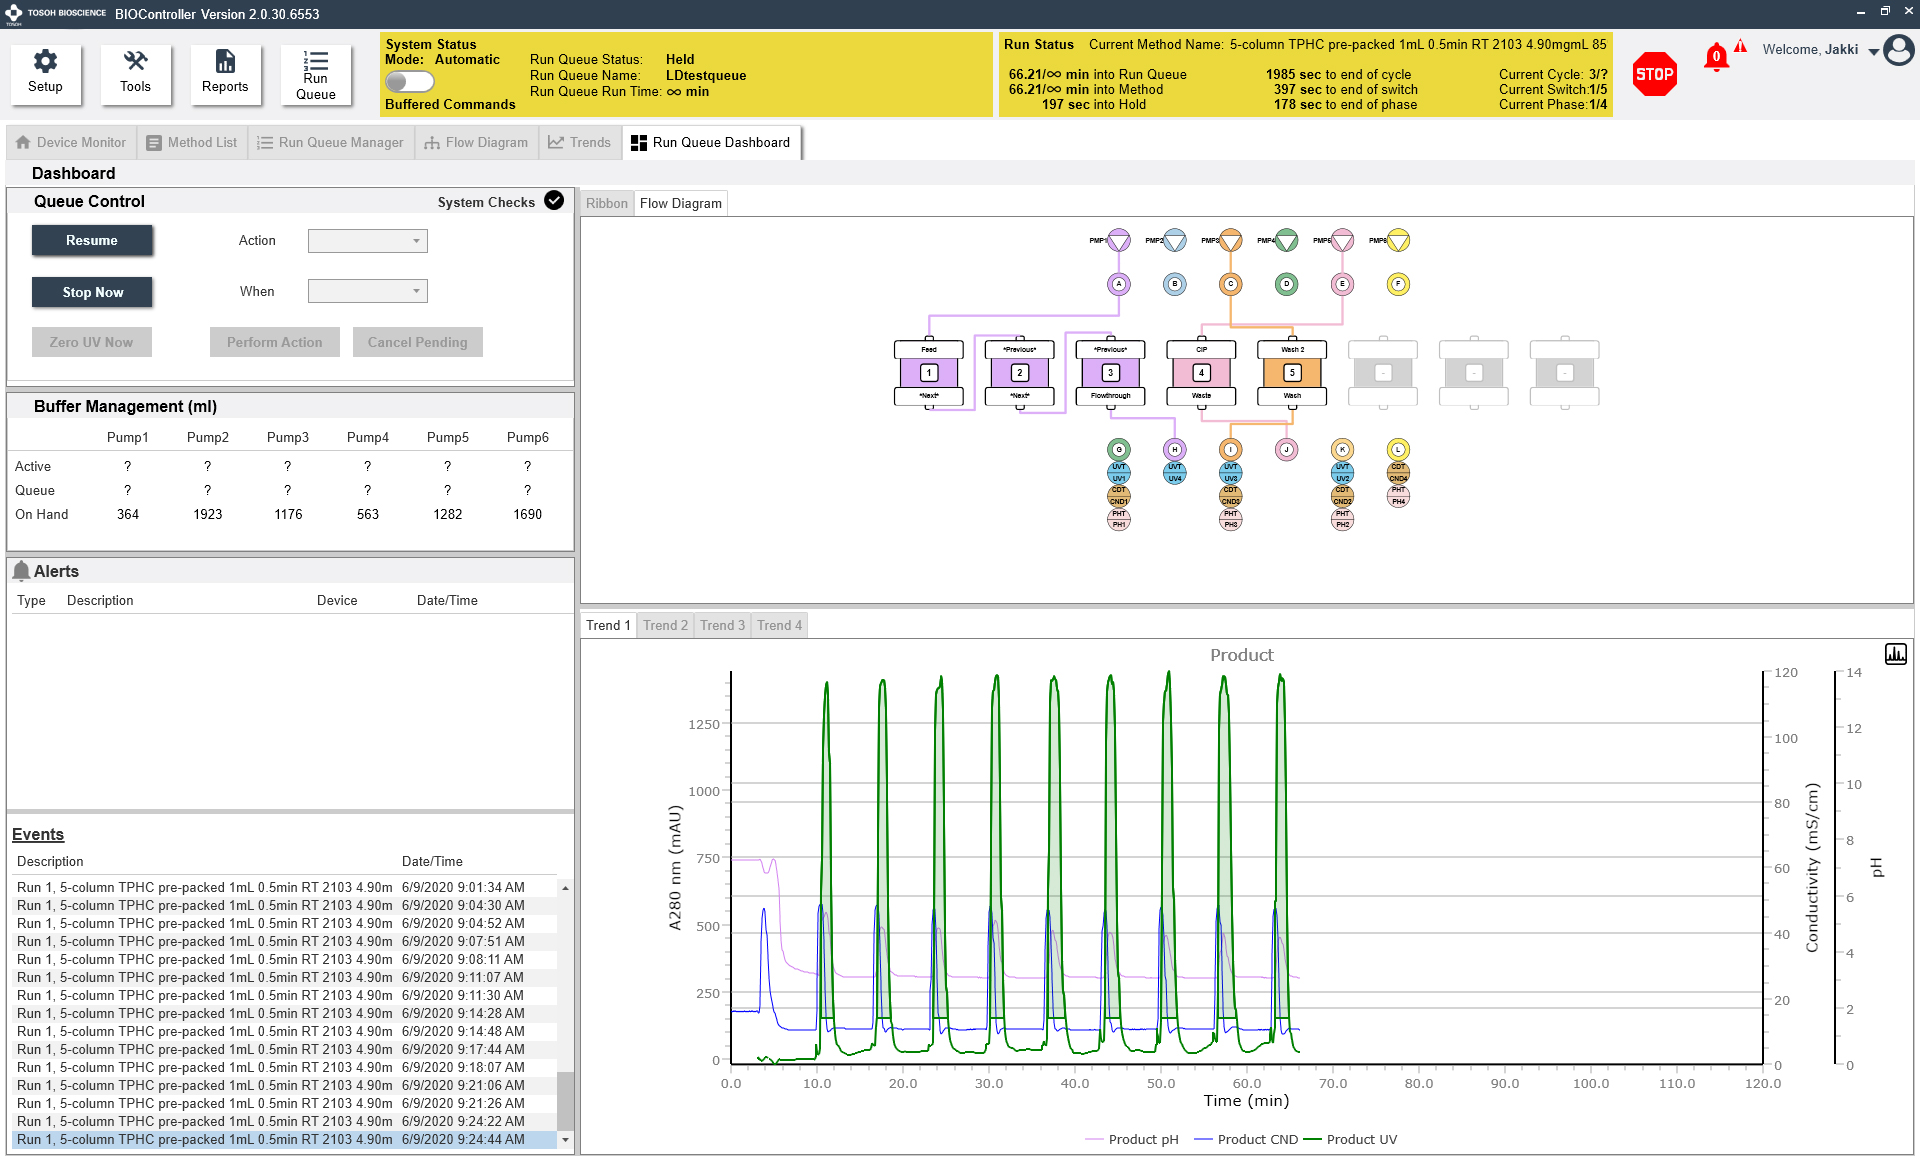
The Run Queue Dashboard displays run controls, animated flow view, trends, buffer status and events on one screen.
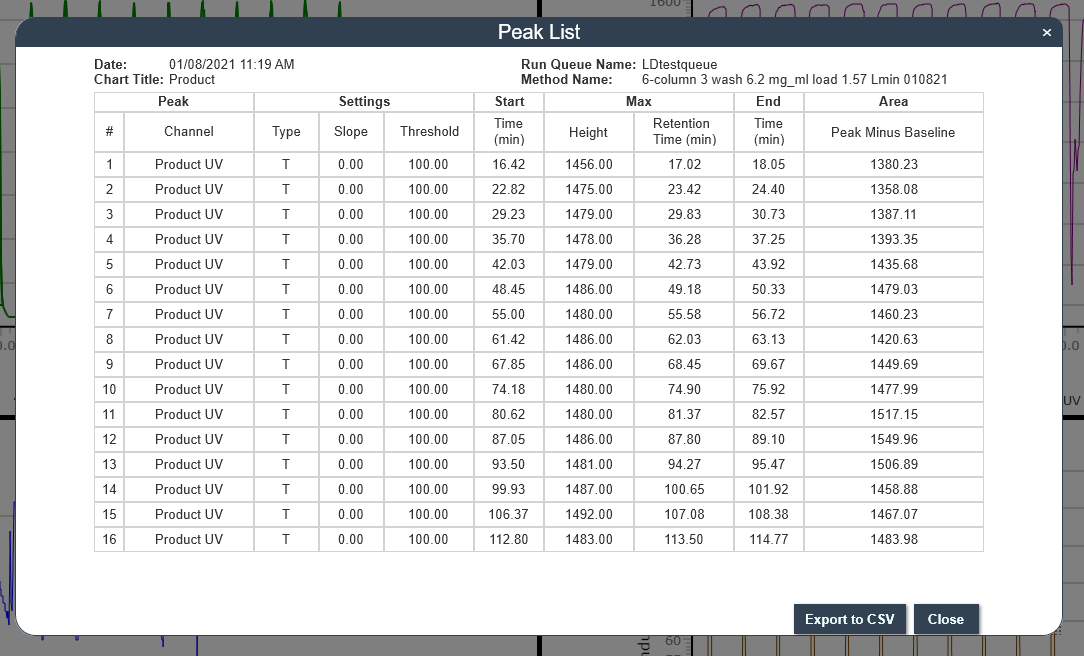
Autosave charts and export peak data as csv files.